


Why do North Dakota and its neighbors have very different economic policies but very similar employment outcomes?
Crossing the Red River

We have a mystery.
Data from the Bureau of Labor Statistics consistently show that North Dakota and its neighbor to the east, Minnesota, have among the highest rates of employment in the United States. As Figure 1 shows, in 2024, the employment ratio in North Dakota — the share of the civilian noninstitutional population actually employed — was the highest out of the 50 states at 67.7% and Minnesota ranked 5th at 66.1%. Indeed, looking at Minnesota’s neighbors (highlighted in purple) we see that each of them made the top 10.
Figure 1: Employment Ratio, 2024
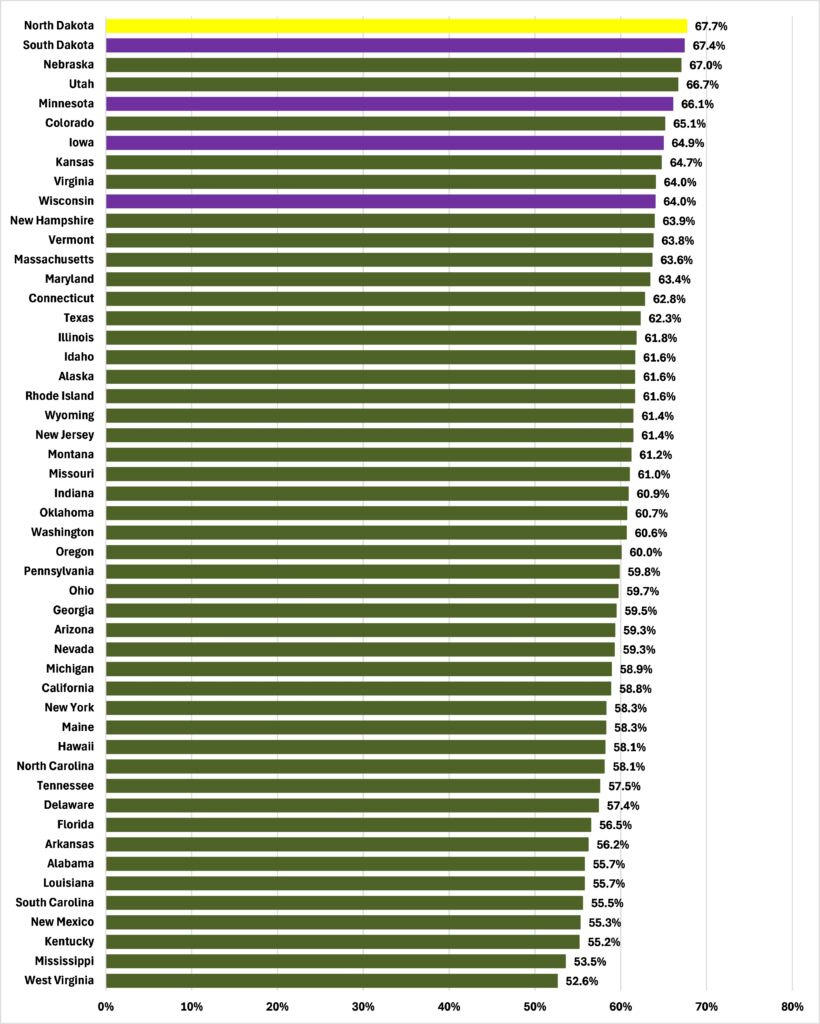
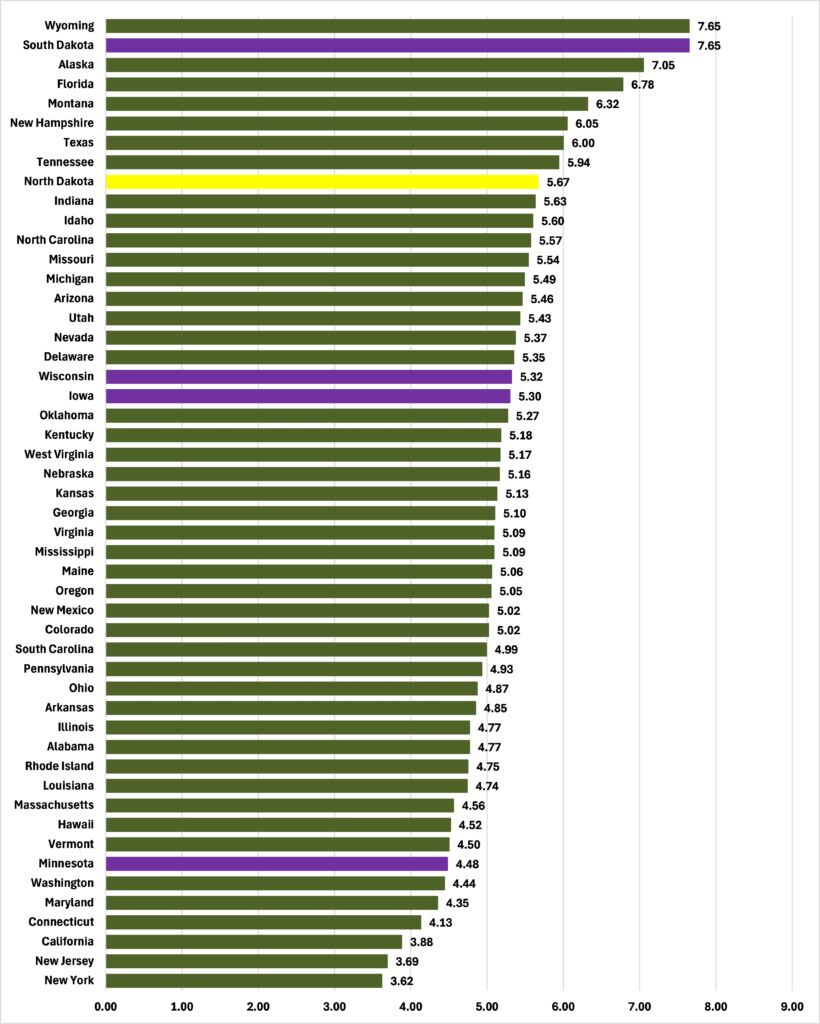
These similar labor market outcomes occur even though the governments of these states pursue very different economic policies. Minnesota has some of the highest rates of state income tax in the United States, while South Dakota doesn’t tax income at all. On the Tax Foundation’s 2025 State Tax Competitiveness Index, Minnesota ranked 44th out of 50 states while South Dakota ranked joint top, as Figure 2 shows. Nevertheless, the employment ratios of these two states differ by just 1.3 percentage points in Figure 1.
Figure 2: State Tax Competitiveness Index scores, 2025
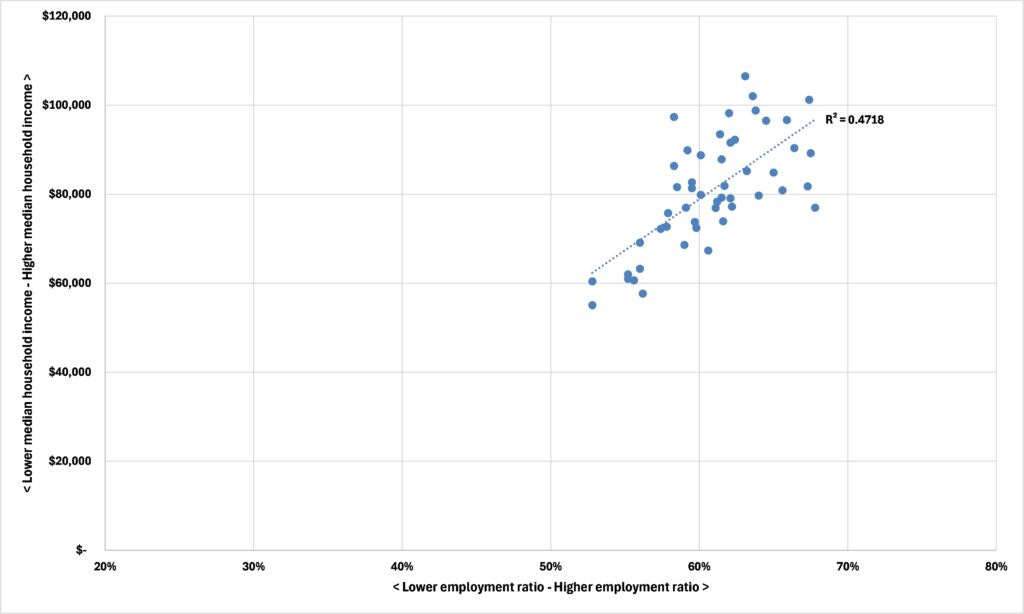
Clearly, then, there is some other factor (or factors) driving high rates of employment in these states besides state economic policy. Identifying this “x-factor” (or factors) is important for understanding variations in economic well-being across the states. The relationship between the employment ratios for 2023 and median household incomes for that year, shown in Figure 3, for example, is both positive, as Figure 4 shows — with higher employment ratios associated with higher household incomes — and statistically significant (the p-value is less than 0.05). With an R2 of 0.471, that means that 47.1% of the variation in median household incomes across the states can be attributed to variations in employment ratios.
Figure 3: Median household income, 2023
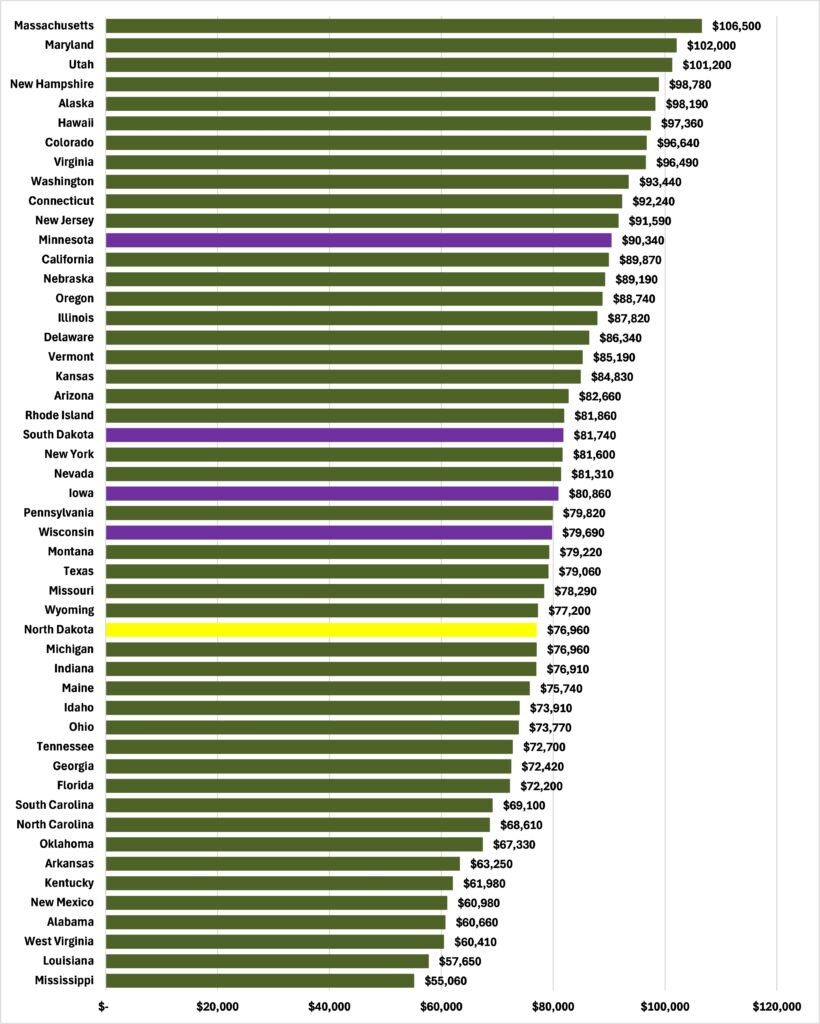
Figure 4: Employment Ratios, 2023, and Median Household Incomes, 2023
What might this “x-factor” (or factors) be?
This article is based on my report “The X-Factor? Social capital and economic well-being: A quantitative analysis.”